Preservation metrics turn complex data into easy to understand numbers.
Conserv Cloud includes seven metrics to help guide you on your journey to better environmental monitoring for your collection:
- % of Time in Range
- % of Time under Fluctuation
- Conserv Score
- Mold Risk Score
- Relative Damage Score
- Lux Hours
- Pest Occurrence Index (POI)
Visualizing Environmental Data
Environmental monitoring software often presents data in a graph format, but squiggly lines can sometimes make it difficult to interpret the information clearly.
The following image shows analytics from the popular HOBOware software.
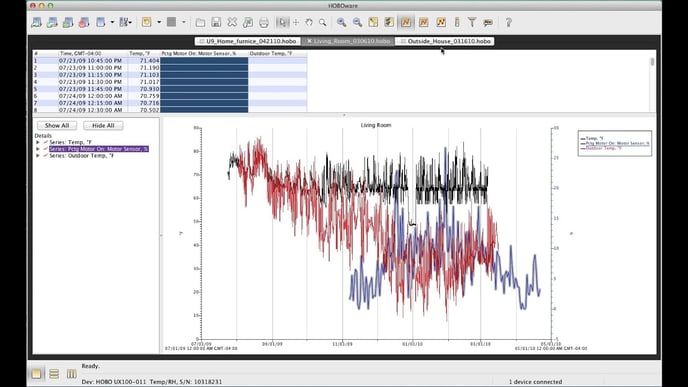
In this example, while the data is recorded, the graph on its own may not provide immediate insights or actionable information.
By focusing on better data representation, you can turn raw data into meaningful insights for the preservation of your collections.
Collection Goals
Conserv is designed to align with your specific environmental goals for your unique collection. Our "Environmental Levels" feature allows you to establish targets for temperature, relative humidity (RH), and light levels.
- Range refers to your target high, low, and average values. For example, you might set a temperature range of 65°F to 75°F, aiming for an average reading of 70°F.
- Fluctuation indicates your desired variation over a 24-hour period. For instance, you may aim for temperature fluctuations not to exceed a maximum of 5°F in a single day.
If you are unsure about where to begin with setting levels for your collection, the Conserv team is here to assist you!
Preservation Metrics
The Conserv Cloud Analytics feature provides preservation metrics. These metrics provide valuable insights into the conditions of your collection, helping you make informed decisions for effective preservation. % of Time in Range, % of Time under Fluctuation
Conserv calculates the percentage of readings that fall within your specified levels for temperature, RH, and light levels.
With this information, you can confidently say that you are within your temperature range 60% of the time last month and 72% of the time this month and know that you are making progress.
See Range and Fluctuation Metrics for more information.Conserv Score
The Conserv Score combines temperature and rh fluctuation data into a rating from A (best) to E (worst). This scoring system is loosely based on guidelines developed by the Canadian Conservation Institute.
Important Note
The Conserv Score was originally designed to assist customers who may have less experience with environmental monitoring. It uses a general target of 50% RH and 70°F as a benchmark to assess the appropriateness of conditions for a collection.
A low Conserv Score does not necessarily indicate that your environment is "wrong" or "bad." Your set points should reflect your building's specific needs and geographical location.
Mold Risk Score
The Mold Risk Score in Conserv Cloud is based on Image Permanence Institute (IPI) metrics. It evaluates temperature and RH conditions that could promote mold growth.
The mold risk score categorizes environments from No Risk to High Risk. For spaces that show indications of mold risk, it is essential to visually inspect the collections within those areas for any signs of mold growth.
See Mold Risk Score for more information.
Time-Weighted Preservation Index
The TWPI provides a standardized measure so you can assess and compare preservation conditions.
A score of 1.15 indicates that damage is occurring 15% faster than expected under optimal conditions. A score of 0.50 signifies that damage is occurring 50% slower than expected.
Credit for this approach goes to Tim Padfield.
See Time-Weighted Preservation Index for more information.
Lux Hours
Conserv Cloud enhanced the Preservation Metrics dashboard by incorporating the total dose of light exposure measured in lux hours. This measurement helps assess the cumulative light exposure on your collection.
Lux hours are calculated by multiplying the intensity of light exposure (in lux) by the duration of that exposure (in hours).
For example, if an object is exposed to 50 lux for 10 hours, the total light exposure is 500 lux hours. Similarly, exposure to 100 lux for 5 hours also results in 500 lux hours.
See Calculated Cumulative Light Exposure for more information.
Pest Occurrence Index (POI)
The POI is a research metric developed by Jane Henderson and Christian Baars. This index provides a normalized view of pest counts in your collection environment by accounting for various factors that can skew data, such as the number of pest monitors and space size, to provide a more accurate count.
Next Steps
Preservation metrics help your team assess progress towards environmental goals and identify underlying issues. If you are ready to enhance your preservation efforts, contact Conserv for free Conserv Cloud access or wireless data loggers and join a community of museums, libraries, and archives committed to excellent collection care.
Get Started with Conserv
Reach out to us to get started with our free software or wireless data loggers. Join a growing group of museums, libraries, and archives that expect more.
