Dashboard
To access the IMP dashboard, sign in to Conserv Cloud and select Pests from the left navigation menu.
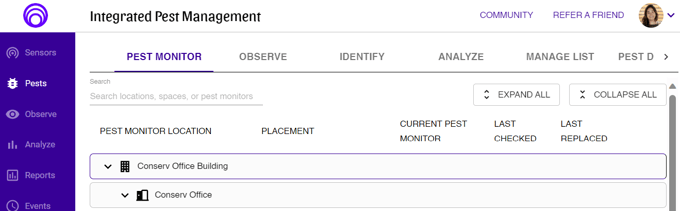
Pest Monitor
The Pest Monitor tab lets you organize your pest monitor locations similarly to how you organize your data loggers.
Observe
After you set up your pest monitors in their designated locations, you can take pictures of the pests that you caught and add those observations to Conserv Cloud.
Identify
This is where you identify the pests from your photos and observations. You can classify and track the types of pests captured, allowing for better management and action planning.
Analyze
The analyze tab displays the graphs that you need to make reports. You can also download tables of your IPM data.
Manage List
The Manage List tab lets you customize which pests appear as options when you identify what you catch in your monitors. The general list is drawn from the Museumpests.net database.
Pest Database
This database provides an embedded Airtable version of the Museumpests.net database. Use it to help you become familiar with pests and read more information on them so you can figure out what they eat and what they need to survive.
Check out this six-minute video that quickly explains the IPM process.