The sensor connectivity indicators are a handy tool for figuring out just how far a signal can go, and how much obstructions like walls, cabinets or floors can affect range. Here are a few tips on how to use them and how to read the numbers.
Radio frequency transmissions can get complicated, but there are some simple guidelines that can help you understand what is happening.
REMEMBER
It's important to first confirm that your gateway is within range first (if you're using a cell connection) by placing a sensor near it to check that it is regularly sending data to the cloud.
Consider these range symbols similar to the connectivity indicators you see on your cell phone.
The greater the number of bars, the greater the connectivity. Even if you don't have three bars it is possible to still have a decent enough connection for the sensor to reliably send all of its readings to the gateway. It may take some time of leaving the sensor in its location and recording some data to confirm this. Ideally you can get most of your sensors 2 bars and above.
The numbers.
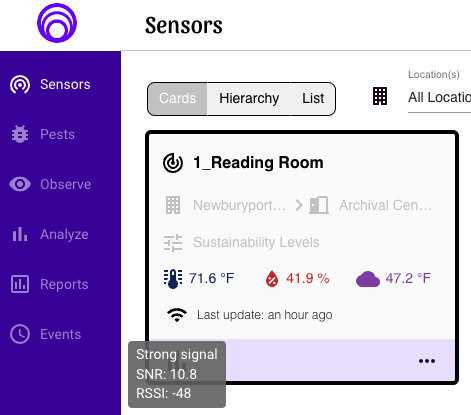
If you hover over the sensor connectivity indicator, it will show you two numbers
Received Signal Strength (RSSI) and Signal to Noise Ratio (SNR).
Received Signal Strength (RSSI)
RSSI is a measurement of the strength of the signal from the gateway to the sensor. It is, essentially, how well the sensor can "hear" the gateway.
The RSSI value ranges from:
- Zero (which would be a perfect connection, and is never achieved in the real world)
- to -145 (a very weak signal).
It is worth noting that even a weak signal can be reliably received, if there is little noise in the environment.
Note that RSSI numbers are all negative numbers. You are looking to get as close to 0 as possible, so -90 is better than -120 because it it closer to 0.
A good rule of thumb is to aim to get an RSSI above -90. We'll talk about noise next.
Signal to Noise Ratio (SNR)
SNR is a measurement of the ratio between the signal (the thing we want transmitted) and noise in the environment (other things happening on the same frequencies that we do not want). It is telling you how much noise you have in your environment.
- Any ratio above zero means that the signal is stronger than any background noise.
- Any ratio below zero means that the background noise is stronger than the signal.
As long as the SNR is above -8, it is possible to successfully separate the signal from the noise and receive the message.
Confused about SNR? Think of it like this: The more negative the number, the more noise in your environment, the harder it will be for your sensor to see your gateway.
A good rule of thumb is to aim for a number greater than -8.
Noise can come from other things using the same frequencies (such as wireless security systems or phones) or from mechanical or electrical equipment. If your city installs other LoRaWAN equipment in your vicinity, that can also increase the noise in your area and disrupt your range.
How We Calculate Connectivity
The connectivity indicator interprets the RSSI and SNR for the sensor, using the following:
| RSSI | SNR | Connectivity |
| Greater or equal to -90 | Greater or equal to -4 | Strong |
| Between -90 and -110 | Greater or equal to -7 | Moderate |
| Less than -110 | Less than -7 | Weak |
A quick note on signal issues
One question that we sometimes get from customers is that a sensor they have not moved used to have a really good signal and now, for some unknown reason, it doesn't anymore. What could have happened?
While your sensor or gateway may not have moved, think about other objects in your environment that may have affected your RSSI and SNR. For example:
- New furniture, closed fire doors or any other physical obstacle (especially with metal components) that has been put up in your spaces could affect your Received Signal Strength. In other words, it can weaken your signal.
- Remember SNR is a measure of noise in your environment. It is completely invisible. Any changes in the frequency of networks around you which may or may not have been caused by you can also cause changes in how much noise your sensor needs to get through to connect to your gateway. These changes will not be obvious, so you might want to ask your IT department if any new systems on radio frequency have been changed or set up. The changes could also be due to city implementations around you, which you will have no control over.
Conclusion
Figuring out the range of a wireless device can be complicated, as it involves understanding the building, what is in it, the relative locations of all of the sensor equipment and what else might be around that creates interference. With the sensor connectivity indicators and a little knowledge, it becomes a little easier!